Our Innovations in Mass Spectrometry and Diagnostics

Our Research

  • Database Management for Cloud Diagnostics
  • Cloud Platform Development
  • Advancements in AST
  • Optimal Clustering for Cancer Diagnostics
  • Virus Identification for COVID-19

Our Patents

Shot-to-Shot Sampling

  • US Patent No. US10,607,823 (March 31, 2020)
  • Korean Patent No. KR10-2258865 (May 26, 2021)

Categorization in Cancer Diagnostics

  • US Patent Nos. US10,319,574 (Jan. 11, 2019)
    US10,910,205 (Feb. 2, 2021)
  • Korean Patent No. KR10-2258866 (May 26, 2021)

Time Intensity in Cancer Diagnostics

  • US Patent No. US10,497,553 (Dec. 3, 2019)
  • Korean Patent No. KR10-2556075 (May 18, 2021)

Virus Inactivation Solutions

  • US Application No. 20190374665 (Pending)
  • Korean Patents Issued: KR10-1894171, KR10-1894172, KR10-1894173

About Us


Founded in 2016, Highland Innovations is located in New Jersey and specializes in creating and managing software for MALDI-TOF technology. We focus on continuous research and development to deliver innovative software applications that make use of MALDI-TOF in various applications. Our goal is to contribute to advancements in the field, providing simple and effective solutions for our clients and the scientific community.

Software

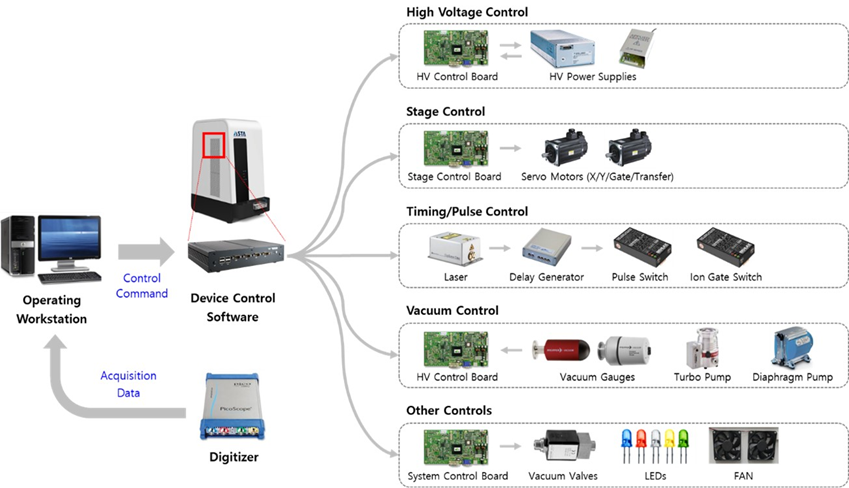
System Control Software

  • Software Functionality:
    • Controls ASTA’s MALDI-TOF Devices.
  • Data Acquisition:
    • Configures and coordinates the data acquisition process.
    • Manages from loading plate phase to the final digitization of detected data.
  • Data Processing and Visualization:
    • Applies processing to raw data for increased signal clarity and strength.
    • Detects peaks in the processed data.
    • Displays results in a user-friendly format.
  • Data Transport:
    • Provides API endpoints for transporting spectral data to supporting software.

Mass Spectral Imaging Software

  • Software Functionality:
    • Displays mass spectral data for a specific region of interest.
  • Visualization Format:
    • Presents mass intensity through a color plot.
  • Application in Spatial Analysis:
    • Useful for visualizing the spatial distribution of proteins, peptides, and lipids.
  • Tissue Slices Analysis:
    • Particularly beneficial for examining thin slices of tissue from animals or plants.
  • Medical Application:
    • Applicable in cancer treatment diagnostics.
  • Diagnostic Capability:
    • Differentiates among tumor stages and identifies metastasis.


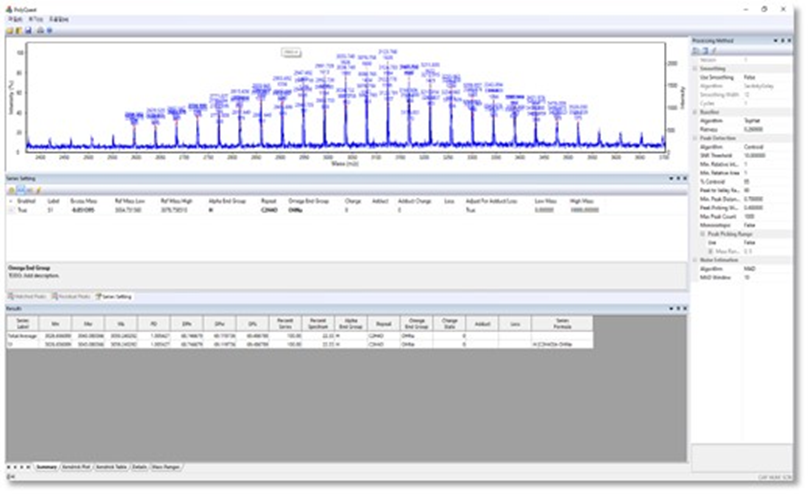
Polymer Analysis Software

  • Molecular Weight Significance:
    • Critical parameter for understanding the physical properties of polymers.
  • MALDI-TOF Accuracy:
    • MALDI-TOF facilitates precise determination of molecular weights for polymers.
  • Supply Requirement:
    • Polymer Analysis Software needed for comprehensive polymer analysis.
  • Analysis Output:
    • Provides analysis in the form of KMD (Kendrick Mass Defect) and copolymer analysis.

Signature Database

  • Data Collection:
    • Collect multiple spectra for the target species.
  • Spectrum Quality Assessment:
    • Apply a spectrum quality algorithm to identify and reject poor-quality spectra.
  • Noise Reduction:
    • Use a smoothing algorithm (e.g., Savitzky-Golay) to filter out noise from the spectra.
  • Baseline Correction:
    • Correct baseline fluctuations using the Top Hat algorithm.
  • Peak Detection:
    • Utilize a peak detection algorithm to select the highest-intensity peaks in the spectra.
  • Peak Ordering and Truncation:
    • Order the selected peaks by frequency.
    • Truncate the peak list to a predetermined number of peaks.
  • Signature Spectra Creation:
    • Combine the truncated spectral data to create one or more signature spectra representing the species.

Micro-Organism Signature Database

  • CoreDB: signature database for human-originated microorganisms. It is made with
    spectrum data from over 2,700 species of bacteria.
  • MycoDB: signature database with 100 species of myco-bacteria.
  • FungiDB: signature database with 116 species of fungi.
  • VetDB: signature database with 627 species of animal-originated bacteria.

MALDI-TOF Spectral Database Management Software

  • Software Functionality:
    • Data Management Software for MALDI-TOF spectral data.
  • Storage and Retrieval:
    • Capable of storing and retrieving spectral data efficiently.
  • User Query Interface:
    • Allows users to retrieve specific spectral data using queries.
  • Cloud Environment Compatibility:
    • Operates in a cloud environment for scalability.
    • Enables the storage of spectral data on a server without limitations.

Disease Analysis Software

  • Software Purpose:
    • Micro-Organism Identification Software for identifying infectious microorganisms.
  • Data Source:
    • Utilizes MALDI-TOF spectral data obtained from patients.
  • Algorithm Implementation:
    • Implements algorithms for evaluating spectral quality.
    • Provides matching scores for accurate microorganism species identification.
  • Process Flow:
    • Receives and utilizes MALDI-TOF data generated by the machines.
  • Matching Algorithm:
    • Utilizes a scoring algorithm to compare generated data with a database of spectrum signatures.
  • Identification Outcome:
    • Determines the most likely microorganism present in the sample.
    • Displays the nearest-matching microorganism species along with a score representing signal quality.
  • Cross-correlation:
    • Cross-correlates the passed spectrum against the signature database.
    • Incorporates additional marker data when necessary for distinguishing visually-similar candidates.

Cancer Diagnosis Software

  • Software Purpose:
    • Cancer Diagnosis Software for diagnosing cancer from MALDI-TOF spectrum data.
  • Data Source:
    • Analyzes mass spectra from blood samples containing proteins or glycans related to early signs of cancer.
  • Spectral Differentiation Challenges:
    • Recognizes that spectral patterns may slightly vary based on patient factors like age, sex, and disease history.
  • Optimal Clustering Method:
    • Utilizes a sophisticated method for finding optimal clustering in the spectral data.
  • Statistical Approach:
    • Employs statistical methods, including p-value analysis, for optimal clustering.
  • Machine Learning Method:
    • Implements machine learning methods, such as Random Forest, for identifying optimal clusters.
  • Spectral Pattern Analysis:
    • Analyzes mass spectra to differentiate and identify patterns associated with cancer.
  • Customized Diagnosis:
    • Tailors diagnosis based on individual patient characteristics captured in the spectral data.

Automatic DB Generation Software

  • Software Purpose:
    • Automatic DB Generation Software for streamlining the complex database development process.
  • Manual Database Development Challenges:
    • Acknowledges challenges in manual database development, including spectrum quality control, identification reliability, and addressing false positive/negative tendencies.
  • Automation Tasks:
    • Pipelines a series of tasks to automate the entire updating process of a database.
      • Generates and validates a CMS DB.
      • Generates and validates a Marker DB.
  • CMS Generation:
    • Combines replicated spectra of a species into a single representative spectrum (CMS – Combined Mass Spectrum).
  • Identification of Similar Species:
    • Utilizes a Marker DB for identifying similar species with closely related strains.
  • Machine Learning Clustering:
    • Clusters profiles of similar species groups using machine learning algorithms such as SVP (Support Vector Machine) and Random Forest.
  • Marker DB Creation:
    • Stores clustering features in a Marker DB.
    • Includes positive and negative markers to enhance sensitivity and specificity.

Custom Database Builder

  • Software Purpose:
    • Custom Database Building Software for user-created databases tailored to specific purposes.
  • User Flexibility:
    • Allows users to create customized databases based on mass profiles obtained from experiments.
  • Additional On-Premise Databases:
    • Enables users to build add-on databases on their premises in addition to the standard provided database.
  • Analysis Tools:
    • Provides analysis tools, including PCA (Principal Component Analysis), Heatmap, and Dendrogram.
  • Data Processing:
    • Process spectral data into database-ready format.
    • Turns MALDI-TOF data into a composite dataset for a specified sample.
  • Statistical Visualization:
    • Offers various statistical visualization tools for the dataset:
      • Heatmap
      • Dendrogram
      • MS Profiling
      • PCA
  • Database Generation:
    • Allows users to finalize the dataset and convert the collection of signatures into a database file.

First name

Last name

Email

Subject

Message

Success

Your form submitted successfully!

Error

Sorry! your form was not submitted properly, Please check the errors above.

(c) Highland Innovations 2024 All rights reserved